

Language:
Español
linSmith
Intro
Tutorial
Screenshots
Download
Compile
Deb/rpm...
Translate
Changelog
Charts
Links
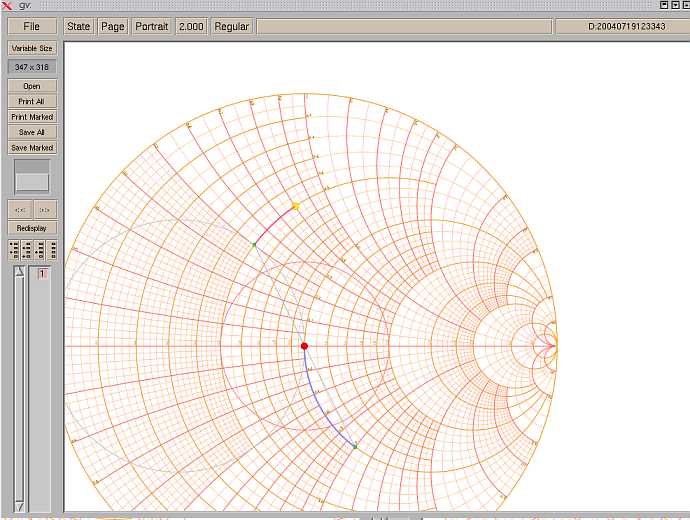 Postscript output
|
It's main features are:
Some distributions have made packages available for easier installation. Be aware that they may be outdated. In that case, consider compiling compiling your own, it's not really that difficult! |
|
This program was written with the help of the GIMP toolkit (GTK+), a
marvelous piece of work, and uses the gnome-print library to generate
Postscript output. Of course, it was developed on Linux, using the
gcc compiler suite and the Glade GUI development system. Graphics items
were designed using the GIMP itself.
I'd like to thank Georg Baum for convincing me to publish the program, and for his help with the packaging. Also thanks to Once (WanShi) Shuiqing for reporting bugs and translating into Chinese (see image).
|
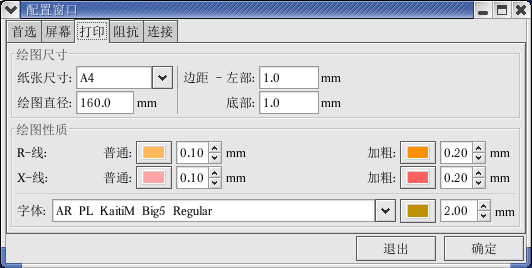
Chinese translation |
| Thanks to SourceForge for the downloading and management services. |
|
A non-paying free software entry at Tucows normally takes 40 - 60 days
to get to the top of the waiting list - more if some mistake is made
at the presentation. Of course, as I don't get paid for the software,
I cannot afford to pay for 'preferencial' treatment.
(Note: Updating Tucows now takes around 200 (!) days. I've given
given up...)
This is also the reason for the fact that linSmith is not rated. The rating has to be paid for...
| Archivo | Tamaño | Contenido |
| linsmith-0.99.30.tar.gz | 1.1 MB | Last published version |
| linsmith-0.99.31.tar.gz | 1.1 MB | Development |
| (c) John Coppens ON6JC/LW3HAZ |